Emulicious Update Available

An update of Emulicious is available!

It comes with serveral new features and some improvements to existing tools.

BIOS files for all supported systems can be selected now. For casual users this can help to improve the authenticity of the emulated system. But also developers can benefit from it because they can test if their rom will be rejected by the BIOS. Additionally, the state of the system after the BIOS will be faithfully reproduced. Appropriate BIOS files can be found on the web.

The Master Everdrive and the Everdrive GG can be emulated now. This feature as well can help to improve the authenticity of the emulated system. Developers can test if their rom is compatible with an Everdrive and also the state of the system after the Everdrive will be faithfully reproduced. To enable Everdrive emulation you need an Everdrive OS file. These can be found on the official website of the Everdrive. You can select a 1bpp font to use with the Everdrive but you can also let Emulicious derive a 1bpp font from the system font. Recent versions of the Everdrive OS come with their own font. They ignore the selected font.

The Memory Editor got expanded by a context menu and its interaction with the Debugger has been improved. Table files can now be manually selected in the Memory Editor and symbol files can now be manually selected in the Debugger. Furthermore, the Memory Editor now supports multi-selection and copy&paste. The Coverage Analyzer also got expanded by a context menu. It allows to exclude selected addresses from the analysis or to reset the collected data for selected addresses.
Emulicious Update Release – New Tools Added

An update of Emulicious has been released!

It comes with some improvements to existing tools and also introduces new tools.

Improvements

The disassembler now also identifies accesses to ports and creates labels for them as well.
Profiler data is now persisted between runs of Emulicious.
When hovering a sprite in the Sprite Editor it now also gets highlighted in the main window.
New errors have been added to expressions that should help with writing correct expressions.

Savestates

Savestates can now be used with hotkeys. The number keys 1-9 load the savestate from the corresponding slot. Holding the CTRL key while pressing the number keys saves into the corresponding slot. If you accidentally loaded a state instead of saving to it you can just undo the load and return to state before loading. The same works for saving. If you accidentally saved into a slot that you wanted to keep you can just undo the save. You can also quick save using CTRL+S and load the quicksave using CTRL+Q. Furthermore, you can setup Emulicious to automatically load the most recent state when a rom is loaded. You can also steup Emulicious to automatically save the current state on exit.

New tools

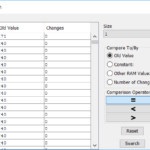
A RAM Search tool (also known as Cheat Search) has been added to Emulicious. It filters RAM addresses based on the comparison of the current value with its previous value. It helps to identify variables within RAM such as the number of lives, the current position, and so on.
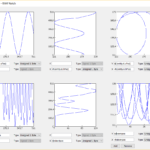
A plotter has been added that can plot the data of a specified range in ROM. It can help to identify tables such as sine/cosine tables or other pattern data.
A RAM Watch tool has been added. It keeps track of the values of specified variables / values in RAM and plots them.

Emulicious RAM Watch
Emulicious RAM Search
Emulicious Plotter
Emulicious Plotter

Emulicious Major Update Release

A major update of Emulicious has been released!

Finally the tools previously only available for the Master System and the Game Gear are now also available for the Game Boy and Game Boy Color. That means that all the viewers, i.e., the Palette Viewer, the Tile Viewer, the Tilemap Viewer and the Sprite Viewer are now also available for the Game Boy and the Game Boy Color. Furthermore, the debugger including the smart disassembler with automated code/data separation and all of its additional tools are also usable for Game Boy and Game Boy Color debugging. These additional tools are the Tracer, the Profiler and the Coverage Analyzer. The only tool that isn’t supported for the Game Boy and the Game Boy Color is the Memory Tracer.

Additionally, the accuracy of Game Boy and Game Boy Color emulation has been improved greatly.

Emulicious Major Update Release

A major update of Emulicious has been released!

It comes with a lot of improvements and additions:

  • Performance
  • The overall performance has been improved.
  • The impact of the debugger on the performance has been reduced significantly.
  • Bugfixes
  • A bug has been fixed that could cause crashes on Linux based systems.
  • A bug has been fixed that could cause Emulicious to run even slower when it couldn’t reach 100%
  • Additions to Emulation
  • Light Phaser Emulation
  • Emulation of 3 and 6 button Mega Drive Controllers
  • Additions to Tooling
  • Hovering over a RAM addresses in the debugger shows its current value
  • The Memory Editor now indicates labels by underlining the corresponding bytes
  • When the Tracer is enabled the debugger now also visualizes the trace
  • The trace in the debugger can now be followed CTRL+Left and CTRL+Right
  • Port Watchpoints can now be added in the Breakpoint Window using the prefix ‚p‘ so entering „pdd“ would add a port breakpoint on port dd.
  • A completely new tool has been added called „Coverage“. It records all accesses to any address. It uses different colors to encode relative numbers of accesses. It uses 3 base colors at different levels of brightness. Yellow means it is accessed significantly more often than green and red means it is accessed significantly more often than yellow. The brightness indicates the relation to other values with the same base color. A brighter color means that it has more accesses than the one with the darker color. The Coverage tool can be used to identify hotspots but also to identify dead code, unused data or unused RAM. In conjunction with breakpoints and stepping it can also be used to identify which code/data/ram is used from one point of the execution to another.
  • An overview ruler has been added to the debugger which is a 1 dimensional representation of the whole file of the debugger. It also shows the colors of the tracer and the coverage tool. It can be clicked to directly scroll to the corresponding address.
  • Misc
  • Patch files can now be loaded like ROM files
  • Screenshots can now be taken by pressing F12