Emulicious Update – Procedure Profiler

An update for Emulicious is available.

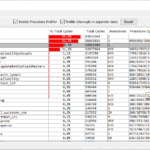
A procedure profiler has been added. It detects procedures automatically and profiles them.

SRAM Watchpoints can now be added in the Memory Editor and in the Breakpoint Window using
the prefix ’s‘ so entering „s0“ would add an SRAM watchpoint on the SRAM address 0.

Support for the new format of z88dk map files has been added.

Emulicious Procedure Profiler

Emulicious Update Available

An update of Emulicious is available!

It comes with serveral new features and some improvements to existing tools.

BIOS files for all supported systems can be selected now. For casual users this can help to improve the authenticity of the emulated system. But also developers can benefit from it because they can test if their rom will be rejected by the BIOS. Additionally, the state of the system after the BIOS will be faithfully reproduced. Appropriate BIOS files can be found on the web.

The Master Everdrive and the Everdrive GG can be emulated now. This feature as well can help to improve the authenticity of the emulated system. Developers can test if their rom is compatible with an Everdrive and also the state of the system after the Everdrive will be faithfully reproduced. To enable Everdrive emulation you need an Everdrive OS file. These can be found on the official website of the Everdrive. You can select a 1bpp font to use with the Everdrive but you can also let Emulicious derive a 1bpp font from the system font. Recent versions of the Everdrive OS come with their own font. They ignore the selected font.

The Memory Editor got expanded by a context menu and its interaction with the Debugger has been improved. Table files can now be manually selected in the Memory Editor and symbol files can now be manually selected in the Debugger. Furthermore, the Memory Editor now supports multi-selection and copy&paste. The Coverage Analyzer also got expanded by a context menu. It allows to exclude selected addresses from the analysis or to reset the collected data for selected addresses.

Emulicious Major Update Release

A major update of Emulicious has been released!

Finally the tools previously only available for the Master System and the Game Gear are now also available for the Game Boy and Game Boy Color. That means that all the viewers, i.e., the Palette Viewer, the Tile Viewer, the Tilemap Viewer and the Sprite Viewer are now also available for the Game Boy and the Game Boy Color. Furthermore, the debugger including the smart disassembler with automated code/data separation and all of its additional tools are also usable for Game Boy and Game Boy Color debugging. These additional tools are the Tracer, the Profiler and the Coverage Analyzer. The only tool that isn’t supported for the Game Boy and the Game Boy Color is the Memory Tracer.

Additionally, the accuracy of Game Boy and Game Boy Color emulation has been improved greatly.

Emulicious Major Update Release

A major update of Emulicious has been released!
For Windows users that don’t have Java installed on their system an alternative download including Java binaries has been added to the Downloads section.
It comes with several new features:

  • The stack now shows labels of the functions that have been called (it can be double-clicked to navigate to the call)
  • The stack now shows the names of the registers that have been stored in it
  • Conditional breakpoints
  • An option for setting uninitialized memory and a breakpoint that breaks on access of uninitialized memory
  • A breakpoint that breaks when an interrupt doesn’t restore the state properly
  • Emulation of PAL for the SEGA Master System
  • Emulation of the screen borders of the SEGA Master System
  • Options to unhide the offscreen area of the SEGA Game Gear
  • DATA labels in the Z80 disassembler
  • RAM labels in the Z80 disassembler

Besides these new features Game Boy emulation has been fixed and the expressions panel has been improved to support more complex expressions.

Z80 disassembler / Master System disassembler

The Z80 disassembler / Master System disassembler has been improved to create DATA labels for data that is referenced. This can help to identify blocks of data more easily. It now also create RAM labels that can help to determine RAM usage and variable sizes.

Expressions/conditions support the following

arithmetic operators: +, -
boolean/logical operators: &, |
shift operators: <<, >>
compare operators: =, ==, !=, <, >, <=, >=
decimal numbers
hex numbers (prefixed by either $ or 0x)
binary numbers (prefixed by %)
symbols loaded from a symfile
variables (see below)
the @ operator to „read“ a value from a calculated address.

Besides that the following variables are supported:
All register names. As single registers and as register pairs.
va (the current vdp address)
scanline (the current scanline)
address (the current address)
bank0 (the bank in slot 0)
bank1 (the bank in slot 1)
bank2 (the bank in slot 2)
For read/write watchpoints only:
value (the value being read/written)
source (the address being read/written)
For write watchpoints only:
oldvalue (the value being overwritten)